Analyzing 50,000 customers in Power BI: Performance problem
- Jihwan Kim
- Mar 19, 2023
- 3 min read
In this writing, I want to present how to create DAX measures for producing an insight when a list of 50,000 customers is given and asked to provide the percentage of customers making 80% of total sales. Something like describing the Pareto analysis.
Under the general situation, when following many good tips from some blog posts and some Youtube videos, we could easily create DAX measures to know how much percentage of customers create 80% of total sales. However, when the count of customers grows up to 10,000 and more, the DAX measures that I found and used before became slow.
In this blog post, firstly, I will limit in Power Query editor to load 1,000 customers and create measures in the way that I previously did to show the expected result. After implementing a parameter that selects and decides how many customers to load, secondly, I will load 10,000 customers, and lastly, I will load 50,000 customers to check whether already written measures still perform well or not, and then I will try to author a new measure and check if it shows better performance or not.
Firstly, let's start with 1,000 customers.
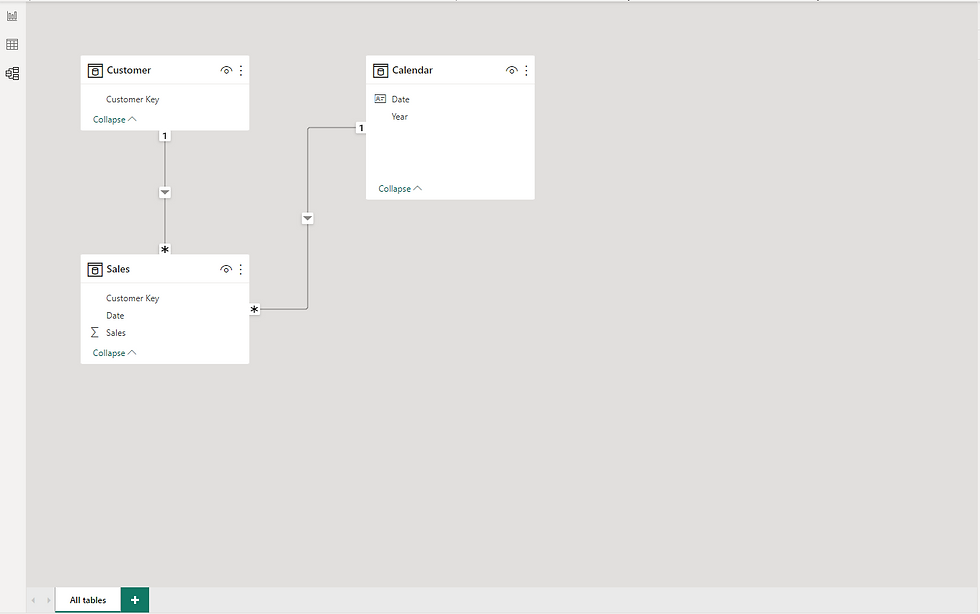
Calendar table

Sales table

Customer table

Datamodel
I author some calculated measures, and then I visualize them as below. Performance is quite OK when analyzing 1,000 customers. The page name is "Test 1".
Sales: = SUM( Sales[Sales] )
Sales cumulate from TOP: = VAR _sales = [Sales:] VAR _cumulatecustomers = FILTER ( ADDCOLUMNS ( ALL ( Customer[Customer Key] ), "@sales", [Sales:], "@currentrowsales", _sales ), [@sales] >= [@currentrowsales] ) RETURN SUMX ( _cumulatecustomers, [@sales] )
Cumulate percentage: =
VAR _allsales =
CALCULATE ( [Sales:], ALL ( Customer[Customer Key] ) )
RETURN
DIVIDE ( [Sales cumulate from TOP:], _allsales )
Customers count that make 80% of all sales: =
COUNTROWS (
FILTER ( DISTINCT ( Customer[Customer Key] ), [Cumulate percentage:] <= 0.8 )
)
Page: Test 1

I also try to use another DAX function, which is the WINDOW DAX function, to show the same result. And the performance is also quite OK. The page name is "Test 2".
Sales cumulate WINDOW DAX: = CALCULATE ( [Sales:], WINDOW ( 1, ABS, 0, REL, ADDCOLUMNS ( ALL ( Customer[Customer Key] ), "@sales", [Sales:] ), ORDERBY ( [@sales], DESC ) ) )
Page: Test 2

Secondly, I start to load 10,000 customers. All the same calculated measures are used, and already, it shows a performance problem like below. And I need to do something.
Page: Test 1

Page: Test 2

I changed one measure, which is accumulating sales from the top sales, like below, and it shows better performance and the same result.
Sales cumulate optimize: = VAR _currentcustomer = MAX ( Customer[Customer Key] ) VAR _customersales = ADDCOLUMNS ( ALL ( Customer[Customer Key] ), "@sales", [Sales:] ) VAR _cumulatesales = ADDCOLUMNS ( _customersales, "@cumulatesales", SUMX ( FILTER ( _customersales, [@sales] >= EARLIER ( [@sales] ) ), [@sales] ) ) RETURN MAXX ( FILTER ( _cumulatesales, Customer[Customer Key] = _currentcustomer ), [@cumulatesales] )
I try many other ways, but so far, the above is the best that I got. I highly appreciate it if someone can help me to write a better one.

Thirdly, I load 50,000 customers. I wait and check how much time it took to load the page "Test 3". I slightly worry, but I try anyway.
I can easily change how many customers I want to load by changing the parameter that I created in Power Query Editor. To load 50,000 customers, I simply enter 50000 into the box below.

As described below, when analyzing 50,000 customers, the performance is not the one I want to see.

I try to fix the measure, [Sales cumulate optimize], but failed to achieve better performance.
To summarize, I could manage to author the measure that shows relatively good performance when analyzing less than 10,000 customers. However, when analyzing 50,000 customers, I need to fix the measure that shows cumulative sales from the top.
I need some help to amend the above measure. But if less than 10,000 customers (or products) are needed to describe the Pareto analysis, I will use the above measure.
I hope this short blog post helps to have better performance when analyzing less than 10,000 numbers of rows in a dimension table.


Comments