Getting a recursive type column in Power Query Editor in Power BI
- Jihwan Kim
- Nov 11, 2022
- 3 min read
In this writing, I want to share how I try to solve questions that ask about getting recursive-type results in Power BI.
I sometimes face a situation, but not very frequently, to provide recursive-type running total answers in order for readers to have meaningful insights from their perspective. For instance, sometimes I get an inventory table containing plus numbers and minus numbers. And asked to calculate the running total but only show above or equal to zero. If a running total is below zero, then show it as zero and reset the running total calculation. I seldom see this type of inventory table. But some people have this kind of inventory table, that feeds their source data after they or their colleagues manipulate, combine, and restructure original source tables (sales orders, shipping, receiving, inventory, etc.) and create this type of table.
I tried to provide a solution by using DAX. However, I kept failing to provide a correct answer unless I add many IF statements or many lines in the SWITCH DAX function. This might cover some of the situations, but it was not the ultimate solution. I also searched on the Power BI Community website, and most of the answers were describing that we could create a recursive type column in Power Query Editor.
This is one of many reasons why I am trying to learn to write M codes in Power Query Editor. I believe many other people like me, who are still button-clicking people in Power Query Editor, also have some kind of their own ways to write M, when the situation happens that there are no ways to provide solutions by just clicking buttons but the only one way is by writing some M codes.
In this blog post, I share how I write M when I face the problem below.
Problem 1
Get the running total of the value, but if the running total is less than zero, then show it as zero and reset the running total calculation.
Problem 2
The situation is the same as Problem 1, however, the data is categorized and the result has to be shown by category.
In Problem 1, the source looks like below.

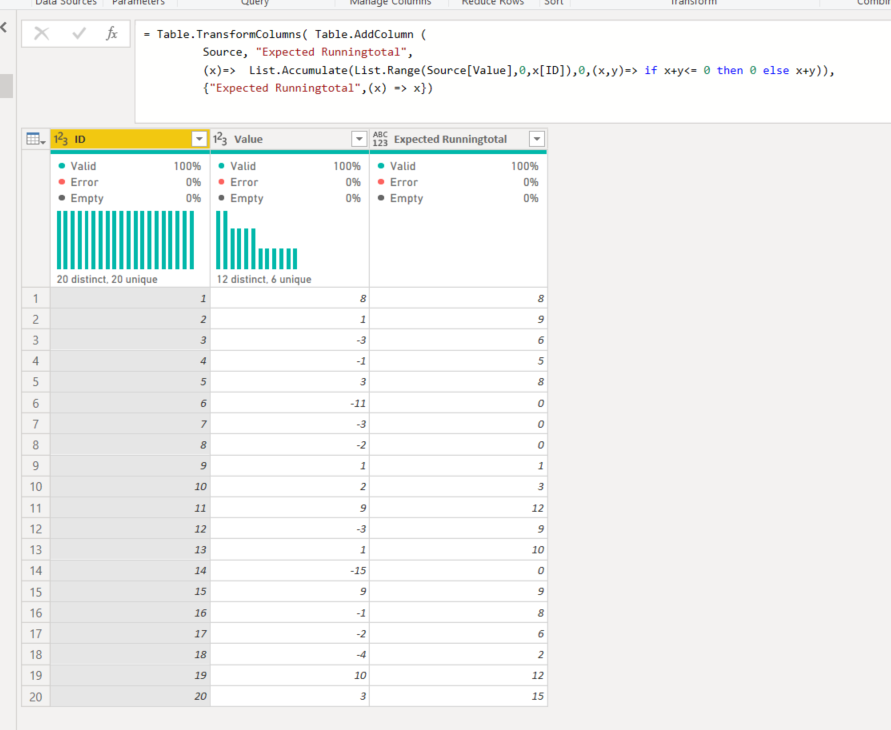
And, by adding a step like the one below, it shows an expected result (The previous step name is, Source).
= Table.TransformColumns( Table.AddColumn (
Source, "Expected Runningtotal",
(x)=> List.Accumulate( List.Range( Source[Value],0,x[ID] ), 0, (x,y) => if x+y <= 0 then 0 else x+y ) ),
{"Expected Runningtotal",(x) => x} )

In Problem 2, the source looks like below.

And, by adding a step like the one below, it shows an expected result.
= Table.Group(Source, {"Category"}, {{"Result", each
Table.TransformColumns( Table.AddColumn (
_, "Expected Runningtotal",
(x)=> List.Accumulate(List.Range(_[Value],0,x[ID]),0,(x,y)=> if x+y<= 0 then 0 else x+y)),
{"Expected Runningtotal",(x) => x})}})

And then, expand the Result column. The expected result is shown below.


If the above two solutions are hard to understand, I suggest just keep learning from many different sources. There are a lot of resources that share valuable knowledge in writing M.
The biggest learning point here is, even if the above M writing solutions are not understandable, now you know that this type of problem is solvable in Power Query Editor, and you know where to find the solution.
I hope this helps the button-clicking type of people, like me, be triggered to start to write M, and have more fun when writing M.
I attached the sample pbix file below.


Comments