The situation that I add a [Sales] column by writing [Qty] X [Unit price] in Power Query Editor
- Jihwan Kim
- Jan 1, 2023
- 3 min read
In this writing, I want to share when I decide to add a column in Power Query Editor, instead of writing a DAX measure in the Power BI data model, which is, in some cases, against the general advice and the best practice in creating the Power BI Data model.
Before I move forward, I would like to mention that this writing is only my opinion, and I am open to listening to any advice from readers on better ways to fix this.
When analyzing sales data, I face some situations that show quantity data in a sales table (fact table), and each product's unit price data in a product table (dimension table). In this case, the general advice is to try calculating the sales amount by authoring the DAX measure something like Sales measure: = SUMX ( Sales, Sales[Qty] * RELATED ( Product[UnitPrice] ) ) in the Power BI Data model, instead of calculating the sales revenue amount in Power Query Editor (quantity X unit price) before loading queries into the Power BI Data model.
However, I faced a situation where I had no choice but to create an additional column (Sales revenue column) in Power Query Editor. The situation was when creating an aggregation table in Direct Query mode.
I have 10 million rows of transaction information in the Sales table. I tried to create a Direct Query mode. 10 million rows of the table that is used in this writing is not a very large table to consider to create an Import mode data model. However, the purpose of doing this under Direct Query mode is to demonstrate.
PROBLEM
The Sales table (fact table) and the Product table (dimension table) look like the below figure.
Sales query

Product query

And then, I tried to create a simple aggregation table, aggregated by product, like below.
Sales_Agg query

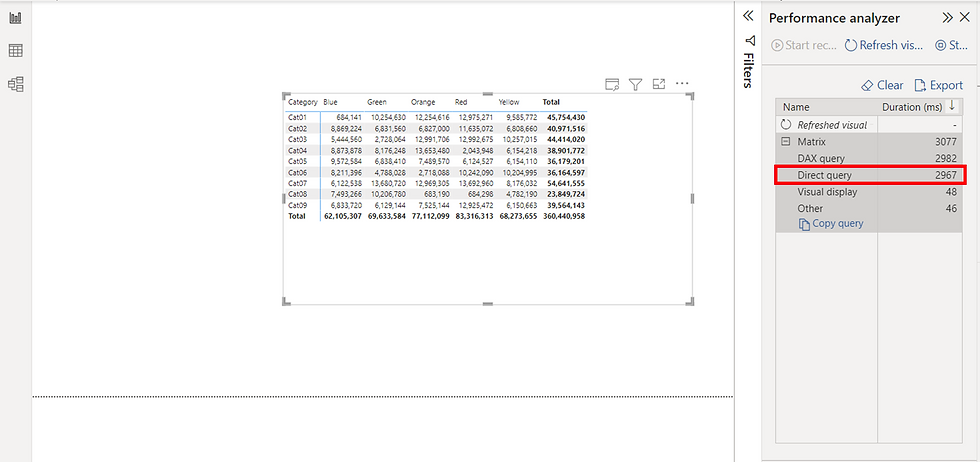
Before configuring the Aggregation table, below is the performance of Direct Query mode.

In order to enhance the performance of the report when showing it by product, I tried to configure the aggregation table like below.

After configuring the aggregation table, the Sales_Agg table is hidden.

However, the table under direct query mode is still used. The Sales_Agg table is not used when using the measure,
Sales: = SUMX ( Sales, Sales[Quantity] * RELATED ( 'Product'[Unit price] ) )

I also tried to create the aggregation table by grouping all dimension information like below, instead of grouping only one dimension information (Product).


But, still, the Sales_Agg table is not used.

SOLUTION?
I could think of one of the solutions to make the DAX measure hit the Sales_Agg table, and that is creating a sales column ( quantity X unit price of each product ) in Power Query Editor before loading it into the Power BI Data model. Or, if possible, ask the data warehouse managing team to add one more column (Sales Revenue column) in the source.
Sales query

Sales_Agg query

And then, configure the Sales_Agg table like below.

As described below, the measure is now hitting the Sales_Agg table.

SUMMARIZE
When authoring a DAX measure that includes the RELATED function to calculate sales revenue amount by using quantity information in the Sales table and unit price information in the Product table, it does not hit the aggregate table. So, be careful when creating Aggregation tables for enhancing the performance of Direct Query mode.
I hope this helps to have more fun playing with Direct Query mode.


Comments